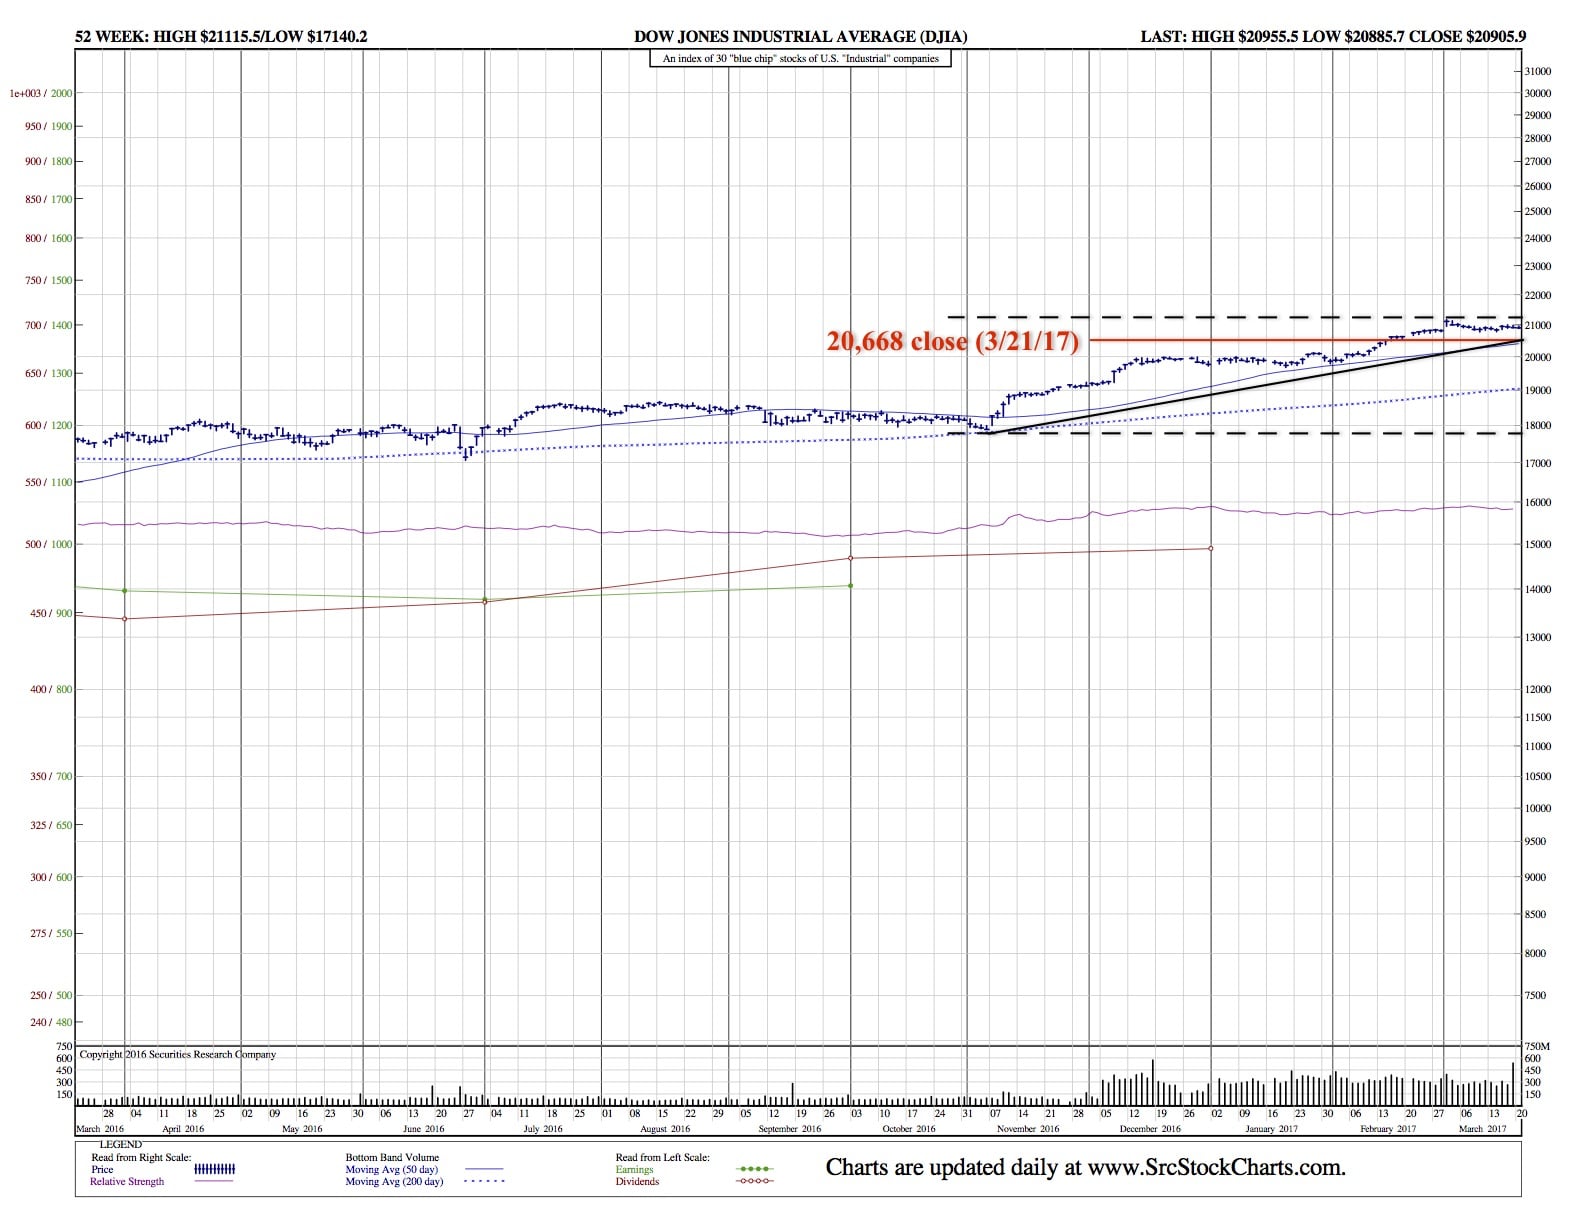
DJIA and S&P 500 Fall by more 1% for the first time in 5 Months (DJIA Daily Chart)
 Yahoo Finance — Stocks had their worst day of 2017 on Tuesday, as the S&P 500 broke a 109-day streak without losing 1% in a day.
When all was said and done, the Dow lost 237 points or 1.1%, the S&P 500 lost 29 points or 1.2%, and the Nasdaq lost 107 points or 1.8%. Meanwhile, the small-cap Russell 2000 was an even bigger loser, dropping 37 points, or 2.7%. U.S. Treasury yields at the long end of the curve also continued a recent rally, with the 10-year yield dropping to 2.41% after trading as high as 2.6% just a few weeks ago.
The S&P 500 is now down about 2% from its most recent peak. In most years, the index drops 10% or more from peak-to-trough during the year.
The big losers on Tuesday bank stocks, with the XLF ETF that tracks the sector dropping 2.9%. Bank stocks are now down roughly 5% in the last week.
The twin worries here for the banking sector were both a flattening yield curve and concerns over President Donald Trump’s difficultly to get a comprehensive tax reform package done given the issues the administration has had with its initial plan to repeal and replace Obamacare.
Individual losers in the banking sector were Goldman Sachs (GS), which lost 2.9% on Tuesday, Bank of America (BAC), which lost 5.8%, and Morgan Stanley (MS), which dropped nearly 4% on Tuesday.
In a note published Tuesday afternoon, Marko Kolanovic at JP Morgan said that options expiring last week would “lift the lid” from market volatility and likely lead to a decline in stock prices. And here we are.
“We maintain that the market is entering a vulnerable phase, where increased volatility can further contribute to equity outflows,” Kolanovic writes. “While we don’t want to minimize the impact of political developments, [Tuesday’s] move was primarily technical and should not be fitted into a political narrative (which in fact was neutral between developments in France and US).”
Analysts at Bespoke Investment Group noted on Tuesday that the S&P 500’s drop was likely to see the index close at non-overbought levels for the first time since early February.
A technical reading of the market, saying the stocks are overbought means the S&P is more than one standard deviation above its 50-day moving average. Or, more simply, that the stock market is significantly ahead of a recent positive trend.
Bespoke added that while conventional wisdom might say market’s resolve lower after breaking a streak of being overbought, the last seven instances of markets breaking this trend have seen stocks gain, on average, 1.6% over the following three months. There have been, however, three instances of markets dropping 5% or more after these trends break, most recently in the summer of 2014.
DJIA Daily Chart: